ProFinancialCharts: A new Flutter package! [Currently private]
A super-smooth financial chart widget that can show candlesticks and line graphs.
Features
I have built everything from scratch,
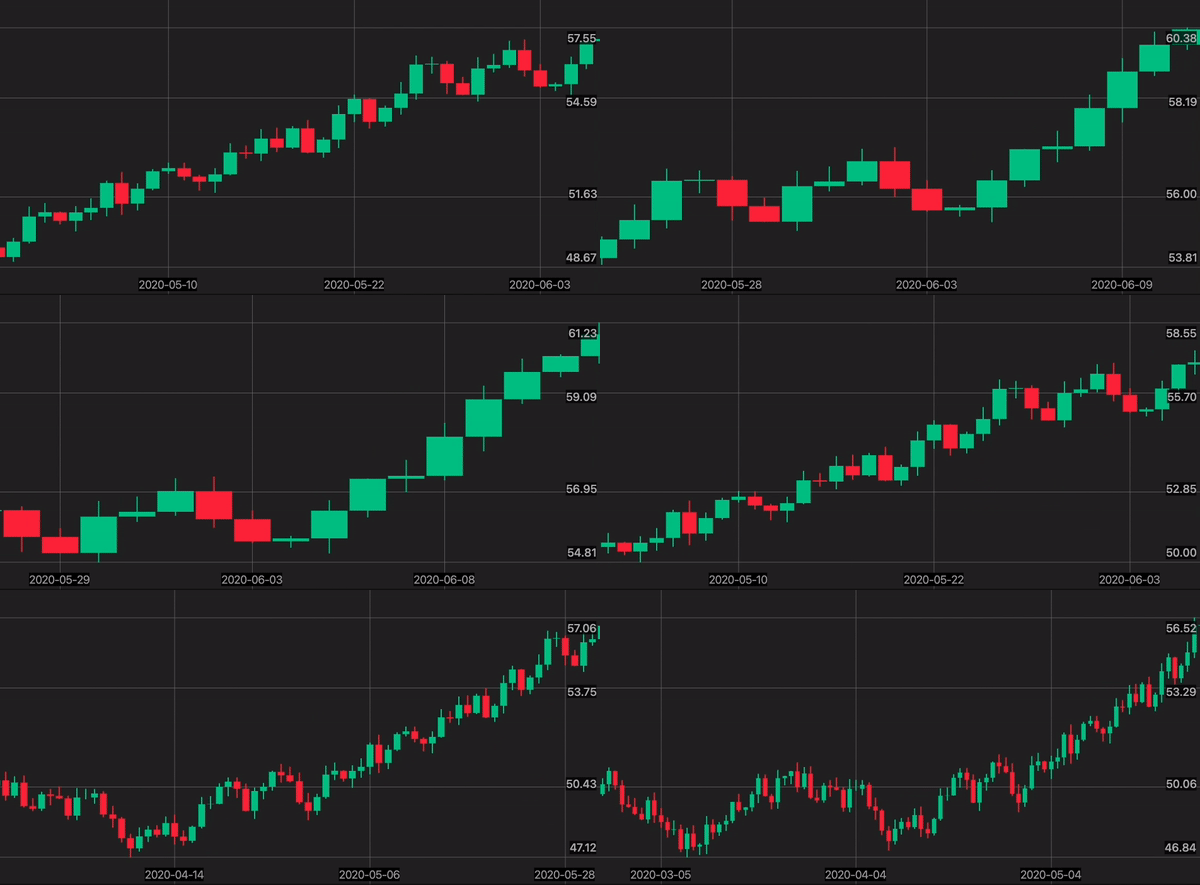
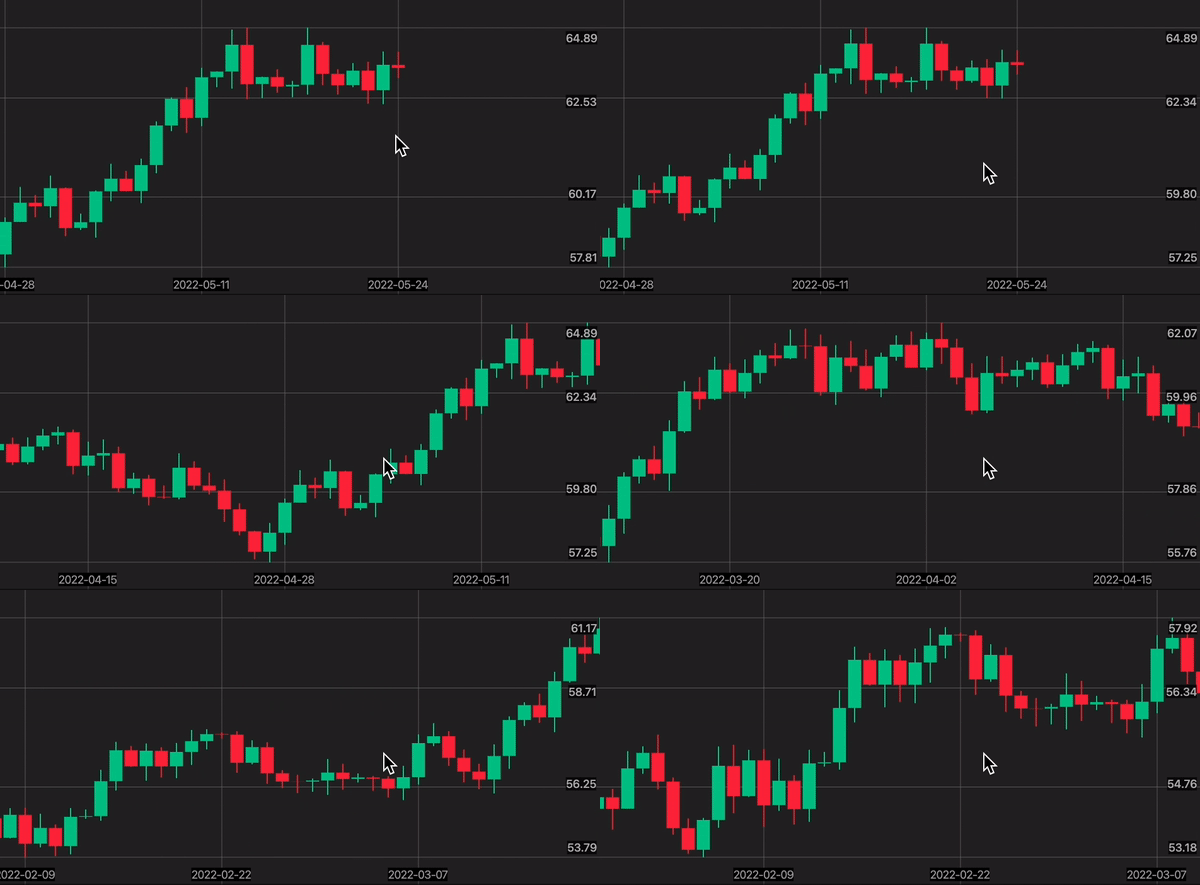
It shows the date/time and price grids,
Zoom in and out (enlarging candlesticks),
 The GIF above is in real-time and the video is not edited.
Auto-fit Vertical Axis (Min & Max Price Visible)
The chart auto fits the vertical axis according to the lowest and highest values that are currently visible to the user. I specifically checked some of the most popular crypto trading/exchange apps like Binance and Woo. I found out that their candle charts are literally lagging even on the latest iPhones.
Creating an auto-fit algorithm is tough but creating a butter-smooth auto-fit algorithm is really difficult. I have used a good amount of knowledge about data structures to achieve high scrolling performance.
 The GIF above is in real-time and the video is not edited.
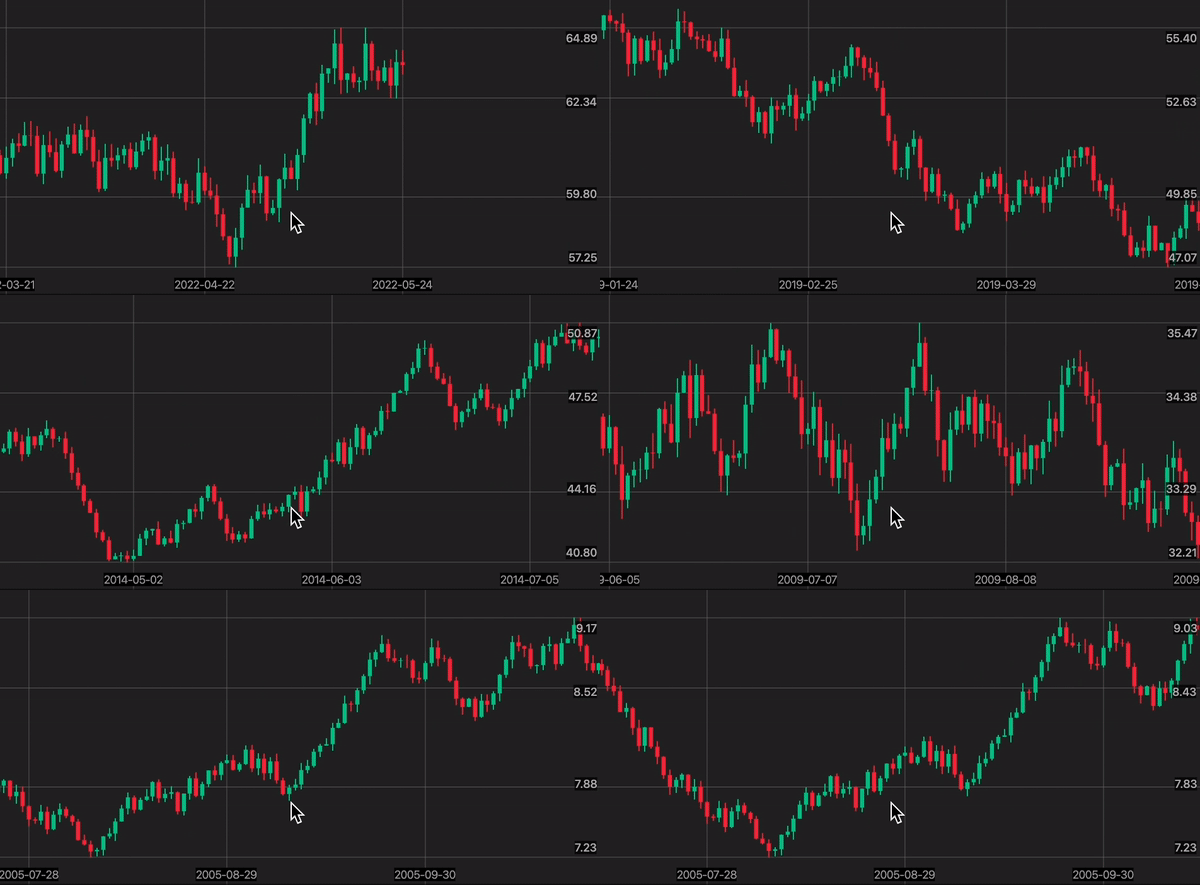
Scroll Back Through History
- It can render +10K candle data in view and scroll through them smoothly. (If you know what I mean, in a daily view, 1 candle represents 1 day and 10,000 days back from today ends up at some date in 1993),
 The GIF above shows the real-time scrolling and the video is not sped up.
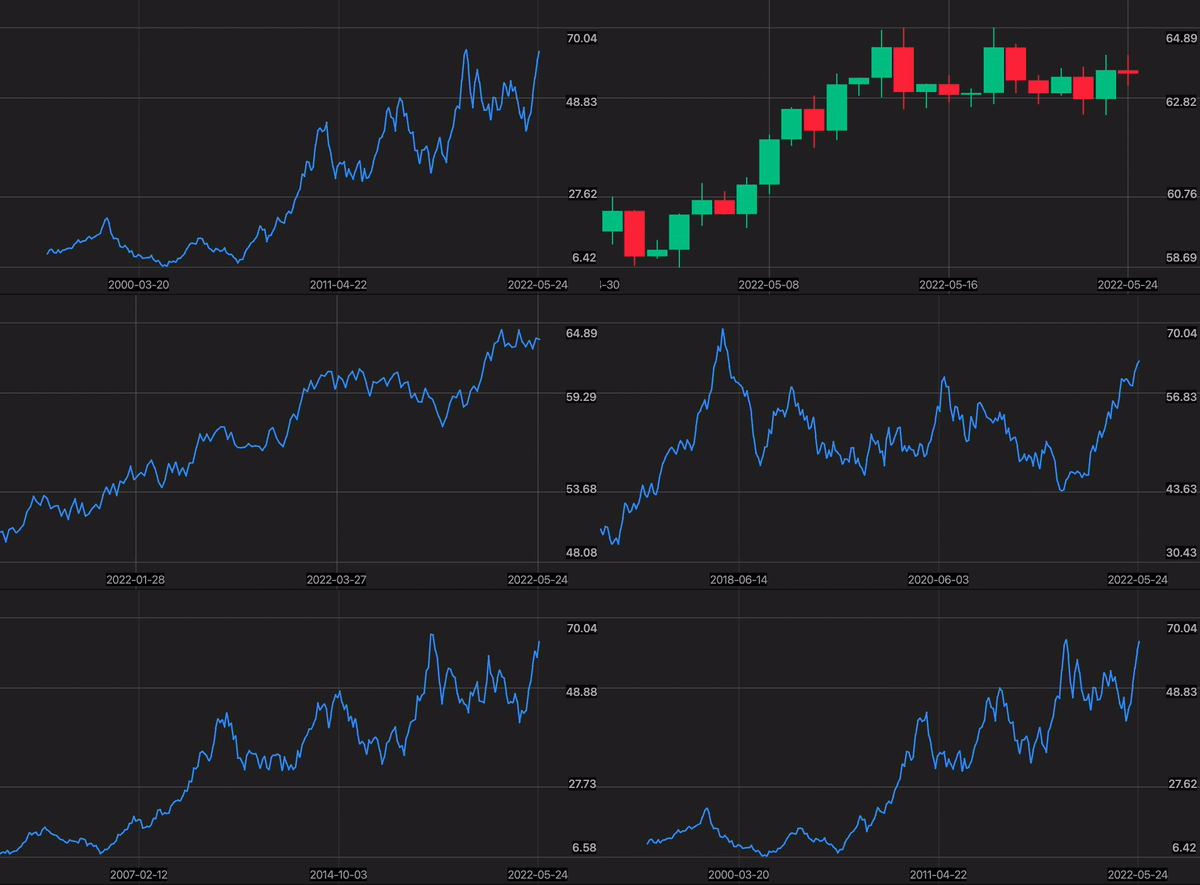
Merge Candlesticks
- It can merge candles into one. For example, it can show 7 daily candles as 1 weekly candle without needing to provide a new dataset,
 The GIF above shows the real-time candle merging and the video is not edited.

![ProFinancialCharts: A new Flutter package! [Currently private]](https://cdn.hashnode.com/res/hashnode/image/upload/v1653406438768/wE2ZoJ8xS.png?w=1600&h=840&fit=crop&crop=entropy&auto=compress,format&format=webp)